Populations and dollar figures are broken down by category: Demographics, Economics, Families, Housing and Social.
Our library of charts gives you insight into data from the places you research. Look for them on profile pages. You can even embed the charts on your own site.
Pre-computed statistics are presented alongside each data point, so you can see how each place fits into a larger context.
Census data is massive, and sometimes it’s hard to find the table you’re looking for. Search by table and column keywords.
We want to help you tell great stories. Maps and distribution charts help uncover what’s interesting, so you can take it from there.
From any comparison, save the data you’re viewing in CSV, Excel or a variety of geographic data formats.
Census Reporter is an independent project to make it easier for journalists to write stories using information from the U.S. Census bureau. Place profiles and comparison pages provide a friendly interface for navigating data, including visualizations for a more useful first look.
 How does median income compare from state to state? More →
 What languages do people speak at home in Los Angeles? More →
 Where are people most mobile, and what skills do they have? More →
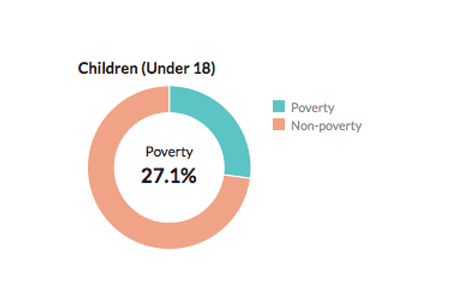 How many children live in poverty in Spokane, Wash.? More →
 What is the racial makeup of the U.S., and how do states compare? More →
 How many people have college degrees in Cleveland? More →
Learn more about the concepts and tables covered by the Census and American Community Survey. We want to help you use this data better, so let us know if there are topics you’d like to see us explain.